Exporting your Trading 212 data is straightforward: go to Menu → History → Export, select your date range (up to one calendar year per export), choose which data to include, and download the CSV. The file contains your full transaction history, orders, dividends, deposits, and withdrawals, ready for analysis in any spreadsheet or portfolio tool.
What Data Can You Export From Trading 212?
Trading 212 lets you export transaction history from your Invest and Stocks ISA accounts. The export covers:
- Orders: all buy and sell transactions, including the price, quantity, and result
- Dividends: every dividend payment received, including withholding tax
- Transactions: deposits, withdrawals, and currency conversions
- Interest: any interest earned on uninvested cash
You can include or exclude each category before downloading. If you only want dividend data, turn off Orders and Transactions. If you want everything, leave all options enabled.
Note: CSV export is not available for CFD accounts, it works only for Invest and Stocks ISA accounts.
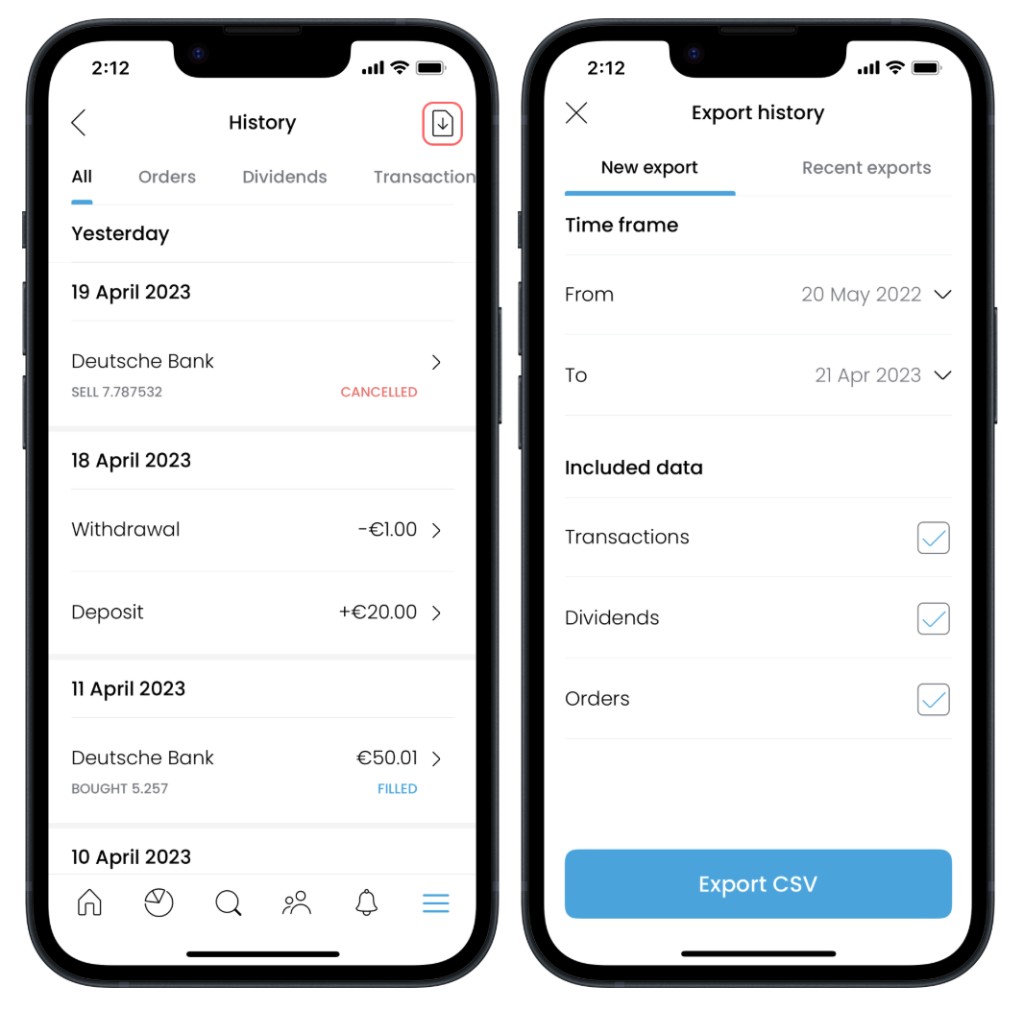
How to Export From the Trading 212 Mobile App
- Open the Trading 212 app and tap the menu icon (top-left or bottom of screen, depending on your version)
- Tap History
- Tap the export icon (usually an arrow or download symbol in the top-right corner)
- Select your start and end date: Trading 212 limits each export to a maximum of one calendar year
- Toggle on or off the data types you want: Orders, Transactions, Dividends, Interest
- Tap Export: the CSV file will download to your device
The file downloads as a .csv and can be opened in Google Sheets, Excel, Numbers, or uploaded directly to a portfolio analysis tool like Vizvest.
How to Export From the Trading 212 Desktop (Web) App
- Log in at trading212.com
- Click your account name or avatar in the top-right corner
- Select History from the dropdown
- Click the Export button
- Choose your date range (up to 12 months)
- Select which data categories to include
- Click Export: the file downloads immediately to your browser's default download folder
The process is identical to mobile, the same CSV format is produced either way.
What's in the Trading 212 CSV? Column-by-Column Breakdown
Once you open the file, you'll see these columns:
| Column | What it means | |---|---| | Action | Type of event: Market buy, Market sell, Dividend, Deposit, Withdrawal, etc. | | Time | Date and time of the transaction (UTC) | | ISIN | International Securities Identification Number for the stock or ETF | | Ticker | The stock's ticker symbol (e.g. AAPL, VUSA) | | Name | Full name of the security | | No. of shares | Quantity of shares bought, sold, or held for dividend | | Price / share | Price per share at time of transaction, in the share's native currency | | Currency (Price / share) | The currency the share trades in (e.g. USD, GBP, EUR) | | Exchange rate | The FX rate applied to convert to your account's base currency | | Result | Profit or loss on the trade, after currency conversion | | Total | Total cash moved (including fees), in your base currency | | Withholding tax | Tax deducted at source on dividends (e.g. 15% US withholding tax) | | Charge amount | Any fee charged by Trading 212 (usually zero for standard trades) | | Notes | Additional context (e.g. "AutoInvest" for Pie transactions) | | ID | Trading 212's internal transaction reference | | Currency conversion fee | FX conversion cost, if applicable |
The most important columns for portfolio analysis are Action, Time, Ticker, No. of shares, Price / share, Exchange rate, Result, and Withholding tax.
The One-Year Limit: How to Export Your Full History
Trading 212 caps each export at one calendar year. If you've been investing for longer, you need to run multiple exports and combine the files.
How to get your full history:
- Export Year 1 (e.g. 1 Jan 2022 – 31 Dec 2022)
- Export Year 2 (e.g. 1 Jan 2023 – 31 Dec 2023)
- Export Year 3 (e.g. 1 Jan 2024 – 31 Dec 2024)
- Export Year 4 (e.g. 1 Jan 2025 to today)
You can then upload the files to a tool like Vizvest for analysis.
Why this matters: If you only upload a partial history, your average purchase prices and P&L calculations will be wrong. Vizvest will warn you if it detects incomplete data, for example, if you're selling shares with no corresponding buy transaction in the file.
Common Export Problems and How to Fix Them
"My dividends are missing"
Make sure the Dividends toggle is switched on before exporting. It's off by default in some versions of the app.
"The file won't open in Excel"
The CSV uses UTF-8 encoding. In Excel, use Data → From Text/CSV rather than double-clicking the file. This prevents special characters (€, £, accented letters in company names) from displaying incorrectly.
"My P&L looks wrong after uploading"
You almost certainly have a partial export. Trading 212 limits exports to 12 months, if you've held a stock for longer, the cost basis from your original purchase won't be in the file. Export your full history year by year and upload all files together.
"I can't find the export button"
The app interface occasionally changes between updates. If History → Export isn't visible, try updating the Trading 212 app to the latest version, or use the desktop web interface instead.
"The exchange rate column is blank"
This happens for transactions in your base currency (e.g. buying a GBP-denominated stock if your account is in GBP). No conversion is needed, so Trading 212 leaves the column empty.
What to Do With Your Exported Data
The CSV on its own is raw data. To get useful insights, dividend income totals, true P&L, yield on cost, trading patterns, you need to run it through an analysis tool.
Options:
- Google Sheets / Excel: manual analysis; flexible but time-consuming
- Vizvest: upload your CSV and get instant dashboards for holdings, dividends, and trading activity. Try it on the Vizvest dashboard →
- Sharesight: paid tool with tax reporting, supports Trading 212 imports
- Portseido: another paid option with multi-broker support
For most Trading 212 investors who want dividend breakdowns, yield on cost, and P&L without building their own spreadsheets, Vizvest is the fastest way to go from raw CSV to actionable insights.
Frequently Asked Questions
Can I export more than 12 months of data at once?
No. Trading 212 limits each export to one calendar year. For a longer history, run separate exports for each year and combine the files. Tools like Vizvest accept multiple CSV uploads and merge them automatically.
What file format does Trading 212 export?
CSV (comma-separated values). The file is UTF-8 encoded and can be opened in any spreadsheet application or portfolio tracker.
Can I export from my ISA and Invest accounts separately?
Yes. If you have both accounts, you'll need to export each one separately. Make sure you're viewing the correct account before initiating the export.
Does the export include fractional shares?
Yes. Trading 212 supports fractional investing and the CSV records fractional quantities (e.g. 0.5 shares of Amazon).
Is my exported data accurate for tax purposes?
The CSV gives you the raw data, but Trading 212 does not calculate your tax for you. For CGT reporting, you'll need to apply HMRC's share matching rules (same-day, 30-day, and Section 104) to determine your taxable gain. A tax professional or a specialist CGT calculator is recommended for this.